Google Analytics.
If you have a website, you probably want to perform as well as possible with it. This comes with a higher number of visitors (traffic) and sales (conversions). There are various tools that speed up this process, such as Google Analytics. And that is precisely what we are working on today: you learn how to use Google Analytics to analyze data from your site and achieve success on the internet.
What is Google Analytics and what it serves
Google Analytics is Google’s own tool that checks and analyzes all types of traffic that a website receives. It’s free, can be installed on any domain, and displays detailed information about visitor behavior on a specific page.
This allows website owners to understand how users who have access to a page consume certain types of content. This can be done by understanding some important statistics, such as the most visited URLs, session time, click through rate, and bounce rate.
If you have Google Analytics installed on your site, you can create content pages & # 39; s and email campaigns that generate more conversions. It is with the response of the clicks of the hits that you can see more accurately what actually works on your site.
Why use Google Analytics on your site
Google Analytics is one of the tools for collecting and analyzing data about a domain. Here you can discover why your content may receive fewer visits than expected and why campaign emails have a low open rate.
Other reasons for using Google Analytics are:
- Know the surfing pattern of users. You can see which pages are visited the most, the average time users spend on a page, which pages have the most sales and which URL prevents them from visiting your site. If you know this information, you can improve the quality of content delivery on certain topics and make optimizations to the layout and the domain as a whole.
- Discover crucial user information. You get detailed information about every user who enters your domain. These include the geographical location with which they came to your site, which language they speak, which browser they prefer, the screen resolution that pages view and whether they prefer personal computers or mobile devices.
How to install Google Analytics
Installing Google Analytics on your site is not difficult. In short, you must add a tracking code to every page of your domain. Follow the tutorial below to complete the process.
Create an account in Google Analytics
The first step is actually creating a Google Analytics account. This is required to start monitoring and analyzing data about your visitors. To do this, do the following:
- Visit the official website of Google Analytics.
- You must have e-mail references from Gmail to enter the tool. Enter your username and login.

- Press the button Sign In (Sign Up).

- On the following screen you must enter the information: Account Name, Website name, Website URL, Business category and Reporting time.

- Finally click on the blue button Receive tracking ID (Receive tracking ID).

- Follow the instructions on the next page by clicking Accept.
Now on the next page you will see the Google Analytics tracking code. It is shown below.
In the above code is the excerpt UA-00,000,000-1 is exclusive and is only for our example of this content. The part UA stands for Universal Analytics. The part 0000000 is the account number. The number 1 stands for the GA Property ID.
Now enter your own GA code in the file index.html it. Google Analytics is installed on your site there. If you prefer, Google offers a complete tutorial on how you can do this.
How to install Google Analytics on WordPress
If you have a WordPress site, you can also enter the tracking code on your site. For this we will show the method to use a plug-in.
Now follow the steps below.
- Access to the control panel (dashboard) from WordPress.
- In the tab plugins, search the plug-in Google Analyticator. Install and activate the plug-in.

- Go back to the tab plugins. click on Google Analyticator. Enter your Google Analytics access data.
- Enter the Tracking code (UA-XXXXXXXX) of your site in the plug-in.
- click on Save and continue.
- Select the Analytics account that you want to track. Authorize your Google account login.
- Click on the button at the bottom of the page save.
How to place absence in wordpress?
Google Analytics interface organization
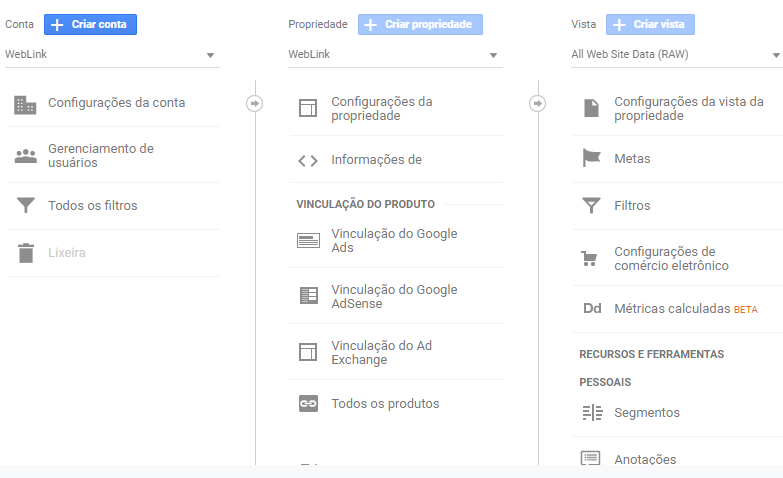
To be able to use Google Analytics better, you must know how the tool is organized. On the administrator side of the main account, it is subdivided into bills, characteristics and sights.

bills
This is the highest hierarchical level within the bills from Google Analytics. Here you can manage users, define privacy issues and create properties. You can create and manage a limit of up to 100 accounts.
characteristics
the characteristics it is the websites (domains) that the user has followed. Here you can configure general settings for your property, such as viewing your tracking code and links to other Google marketing services (advertisements, Adsense and Search Console).
sights
the sights define how data reports from a property are being displayed. Here you can define metadata for all pages of your site, as well as filters to determine what types of reports you want to receive.
How to use Google Analytics to measure data
It is time to learn the most important Google Analytics statistics. Knowing the terminologies and what they are meant to do, you can improve the quality of your content and optimize the page design to attract more visitors and generate more conversions.
Google Analytics has 5 reporting fields with statistics with data on user behavior in a domain. They are:
- In real time;
- Target audience;
- acquisition;
- behaviour;
- Conversions.
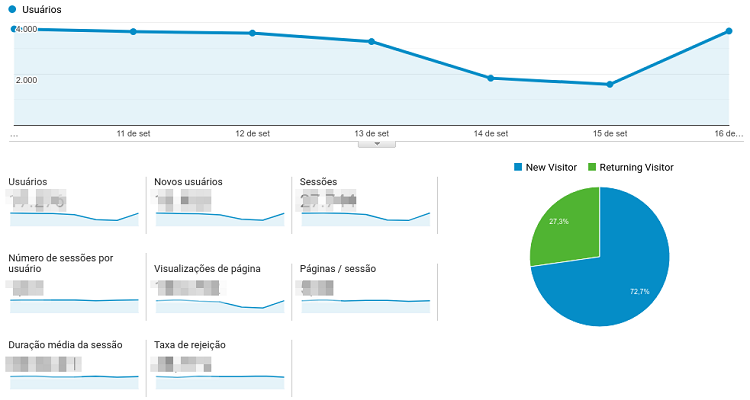
Below are the category statistics target, which shows the performance of a domain in total numbers from the perspective of access and user interaction on a site.

Users
Indicates how many unique visitors a site receives in a given period. Here they are not counted every time the same user has entered your site, only the first and first time they have reached your domain. Therefore, regardless of whether a visitor visits the same site 50 times a day, the number corresponding to that same user is 1.
Sessions (Sessions)
These are all visits, hits and interactions that a user makes on a site. Unlike the Users statistic, they are counted here every time users enter the domain. So if a single user visits the same site 50 times a day, 50 sessions are counted.
Page Views (Hits)
Shows the total number of views of a page, possibly for the entire domain or for specific subdomains. This counts both individual users and sessions that are repeated by the same user or different visitors. You can separate the number of views on page types, such as landing page & # 39; s, blog content or user-specific areas such as contact forms and forums.
Average session duration (average session duration)
Shows the average duration of a session for an entire site. The higher this number, the more users spend more time on domain pages. The smaller, the less interested they are in the content of a site. It shows the quality of the visit and how much time the user spends browsing within a domain.
Bounce rate
Determines the percentage of user interaction (sessions) with the first page accessed from a domain. It does not specify exactly how long a user spent on a page and then closed the browser tab. But the usability mode, which reports that this user has only visited one page and has not interacted with another page.
conclusion
Google Analytics is a powerful tool for every type of project on the internet. Here you can understand how each page within a domain performs and you can make content improvements and page optimizations for a better user experience of visitors.
In this content we show a short tutorial for installing and setting up Google Analytics for your domain. It also presents some of the most important statistics of the tool. The following steps are up to you: write high-quality content, get more visitors and get more conversions on the internet.


